IBM and Coronavirus stories
The Self-Assembled IBM Team Behind Two Widely Used COVID-19 Data Tracking Tools
By John Buscemi
For Misha Sulpovar, an AI product leader at IBM’s The Weather Company, COVID-19 was personal.
His wife, Jiyoung, is Korean, and they have family in South Korea, as well as friends in China. And so the couple had closely followed the outbreak in those countries from the beginning. By early March, when it was evident the pandemic was becoming global, Sulpovar, who is based in Atlanta, had further cause for concern.
Last year, his team helped develop Flu Insights with Watson, a tool that uses The Weather Company data to provide a 15-day flu forecast. He became familiar with that ailment’s epidemiology. And so, when COVID-19 came along, Sulpovar realized the world was facing a much more serious threat: a highly contagious disease, with a relatively high mortality rate, that can spread before those who are infected develop symptoms.
Sulpovar knew that scientists, doctors and the public would need robust data tools to track the disease, if they hoped to slow its spread—tools that IBM could create.
On March 13, as he and many other IBMers had begun working remotely at the company's urging, Sulpovar went into action. He and a colleague, IBM Distinguished Engineer Bill Higgins, who was working from his home in Raleigh, N.C., started brainstorming online.
Within a few days they had virtually assembled an ad hoc team of developers, designers and other IBM experts, who started bouncing ideas off each other in a COVID-19 data channel they set up on Slack.

Misha Sulpovar (left), Bill Higgins (right) and team (thumbnails), collaborating on The Weather Company's COVID-19 data tools
The Need for Trusted Data
At the same time, separate teams at The Weather Channel and IBM Cognos Analytics were already building proofs-of-concept for mapping the outbreak. They were hampered, though, by having access only to limited and incomplete data from various health, government and academic websites.
“We saw that there was no global repository for trusted COVID-19 data, at a time when everyone around the world was desperate for that information,” Sulpovar said. “Together, we could make a real contribution by building tools that automatically gather COVID-19 information from trusted sources—including national, county and local health departments—and displaying it in a consumable form.”
He and Higgins took their proposal to IBM’s chief data officer for cloud and cognitive software, Seth Dobrin, who was operating from home in Ridgefield, Conn. Dobrin brought it to IBM’s COVID-19 Task Force, which had been formed under Director of Research Dario Gil’s leadership to help fight the pandemic.
One of the task force’s goals is helping businesses, governments and citizens around the world make better decisions during the crisis by providing them with trusted data. Recognizing the value of the proposal Dobrin had brought forward, the task force immediately gave approval.
“Once Seth gave us the green light on behalf of Dario and the task force, we shifted into a higher gear,” Higgins said. “We created a Slack channel called #covid-data-war-room, started a Webex group, and simultaneously started to design and code what would become the initial release, while recruiting other IBMers with relevant skills to more quickly divide and conquer on the many tasks we’d need to complete. The race was on.”
It was now March 16, and the project was quickly building momentum. But success would depend on the team’s ability to represent complex data in simple, yet powerful, visuals.
Sheri Bachstein, vice president and head of The Weather Company, led the way for The Weather Channel digital team to create and host the consumer-facing applications. Sam Wong, head of business solutions for IBM Business Analytics, made the Cognos-based interactive dashboard he and his team had been designing available on the IBM Cloud.
Agile Collaboration
IBM in recent years has been a practitioner of Agile development—an approach to business methods that emphasizes collaboration among self-organizing, cross-functional teams. In this case, the agility culture once again proved its value. About 100 IBM coders quickly organized themselves into four groups.
A team from The Weather Company was responsible for design, user experience and building a scalable data applications programming interface, or API.
A Watson and Weather AI team took charge of collecting data and organizing it into usable form, and designing the data pipeline using Watson Natural Language Processing (NLP) technology.
A Cloud Platform team created the network architecture and designed the data repository on the IBM Cloud.
A team from the Chief Data Office handled data governance, to ensure that IBM had the permission to use the data in the tracking tools.
Collaborating via Slack, Webex and other digital team methods, the group created two complementary COVID-19 tracking tools in just five days—a volume of work that might normally require months to complete.
Two New Data Offerings, Free to the Public
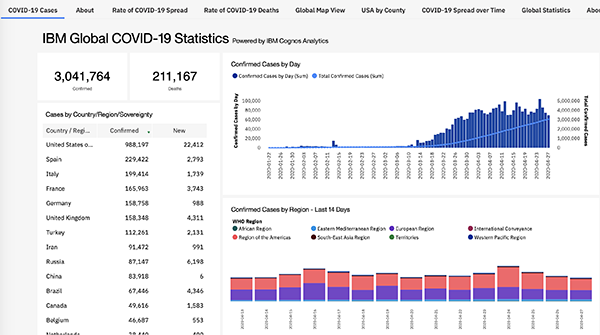
The IBM Cognos Analytics COVID-19 interactive dashboard
One of the new offerings is called the Incidents Map, for IBM’s The Weather Channel app and weather.com website. Available for free, it provides COVID-19 data and statistics, including confirmed cases and more by U.S. state and by county, where available.
The Incidents Map also includes the latest COVID-19 news and video from The Weather Channel’s editorial team, as well as public health information and patient education materials. The team recently added international information and country-level data; it expects to provide local data for selected countries soon.
The team’s other innovation was an interactive dashboard, driven by IBM Watson AI capabilities and built on the IBM Cognos Analytics platform. Also available at no charge, the dashboard is designed to help users such as data scientists, researchers, media organizations and more conduct a deeper analysis and filtering of geographical data. Available global data includes confirmed cases and recoveries, where available. Users can drill down to the country, region, state and county level as needed.
Embraced by Tens of Millions
The COVID-19 hub of data and news on The Weather Channel app and weather.com has been visited more than 127 million times, with an average of nearly four million daily visitors. In addition, millions have visited the dashboard.
“The way the organization came together is a monument to IBM’s unique culture,” Sulpovar said. “IBMers who didn’t necessarily know each other teamed up in an atmosphere of complete trust to tackle a tough project—and succeeded.”
His partner in launching the effort, Higgins, also acknowledged the teamwork involved, under trying conditions.
“This experience has been especially inspirational because it demonstrates the unmatched value of one of IBM’s most cherished practices: Unite to get it done now,” Higgins said. “I’ve never been prouder to be an IBMer.”
→ Visit the IBM News Room's complete coverage of IBM's response to the coronavirus pandemic